
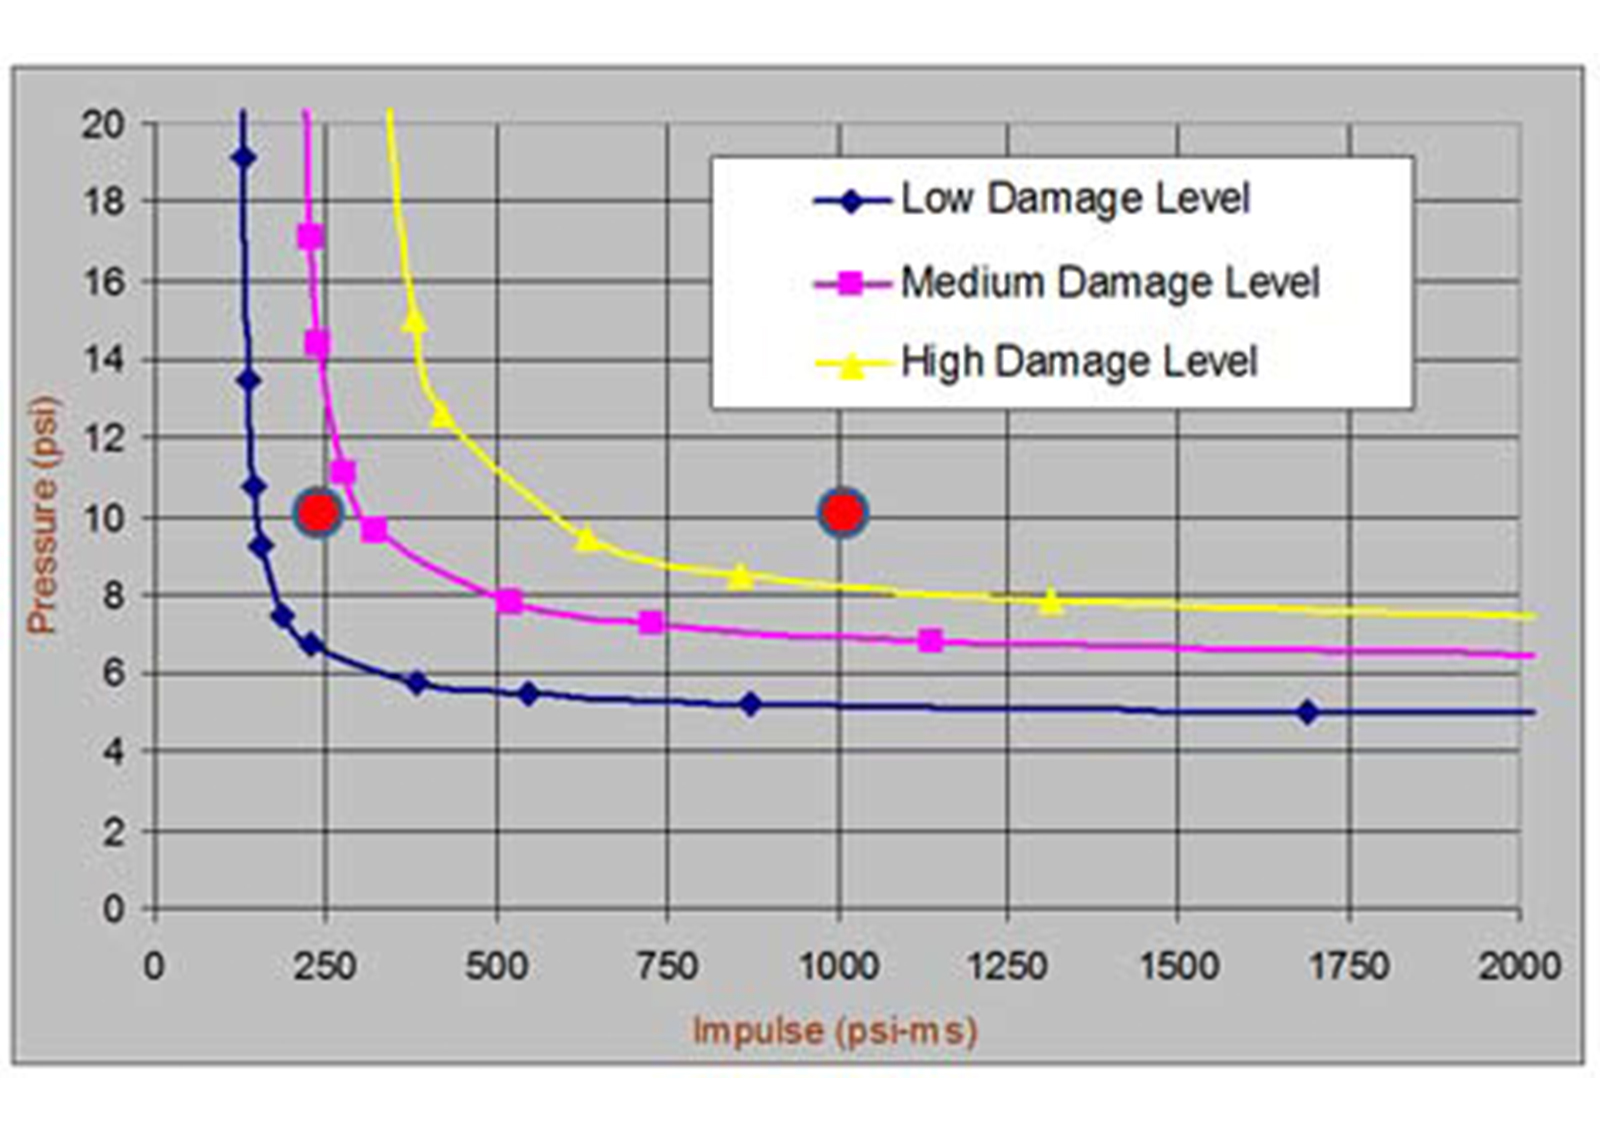

One of the most basic mistakes made is to calculate the lethality values of the people in the building only according to the burst pressure value. Building damage depends not only on the burst pressure value but also on the impulse value. Also, the curves used in CIA and API 752 are for some typical building types only. In other words, they cannot represent the actual behavior of the building in that facility in the face of the explosion. Therefore, Pressure - Impulse curves for each structure should be prepared by structural engineers specialized in explosion and used in vulnerability analysis.
In risk analyses, overshoot curves are derived for bursting pressures and these curves are used to calculate the damages that may occur during possible explosion scenarios of the buildings in the facilities. There are hundreds of explosion scenarios in a typical petrochemical plant and very different explosion design pressure values are seen at different frequency values. The difference between the 10^-4 frequency value and the 10^-6 frequency value is approximately 30 times in the "burst-pressure overshoot curves" graph in Figure-1. One of the typical mistakes is designing by considering only the frequency value of 10^-4 and performing explosion analysis of buildings. As can be seen from the graph, in this case, a very small decrease in the frequency value will increase the explosion pressure value and when an explosion scenario suitable for this situation is encountered, the building designed according to the pressure corresponding to the 10^-4 frequency will collapse. Overshoot curves are generally given for mean values. In fact, there is considerable uncertainty around this mean value. Variations in these values should be interpreted very carefully by experts in risk analysis studies to avoid faulty building design.
Another mistake is that only process risks are taken into account in risk analysis and other risks (earthquake, storm, flood, etc.) are not given importance. Failure to take such risks leads to an incomplete risk analysis. Sometimes the process causes an increase in the process risk by making earthquake, storm and flood domino effect. The most important examples of this were seen in the effects of the 1999 Kocaeli earthquake in Tüpraş and in Texas during the 2017 Harvey hurricane. Due to the power outage caused by the flood, the facility faced significant explosions and fires.